
From Images to Insights: How Zelloscope Works
Zelloscope transforms foam images into real-time insights you can act on.
Let us show you how

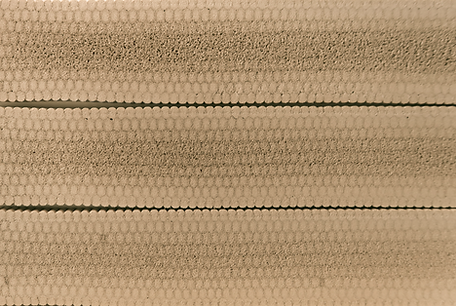
1. Segmentation reveals the cells
After our inline or lab system captures an image of your foam, our AI model instantly segments the cell structure – calculating a cell diameter and X/Y position for every cell. From just these three datapoints, you already gain deep structural insights.
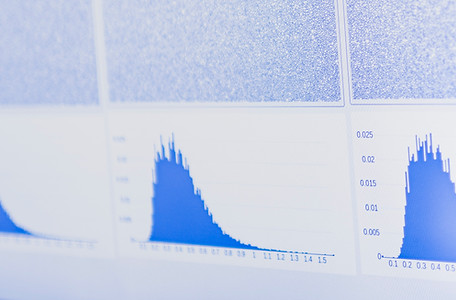
2. Histograms show the big picture
From the cell diameters, we create a histogram that quickly shows us a basic understanding of the cell structure. It’s a simple visual that shows how your foam production is performing and how close you are to achieve the ideal structure.
The PPI - Pores Per linear Inch is a good indication of the mechanical properties of a foam. The higher the PPI the better are the mechanical properties for a given density.

3. KPIs for deeper understanding
By looking at every individual cell position we don't only get an overview of the production process. When we dig deeper, we also learn a lot about critical quality indicators, including:
-
Coalescence index – early warning if cells are merging, Use Hopkins, Ripleys or Moran's Index for Local Indication of Spatial association
-
Edge-Center Imbalances - For full area scanning, do you have issues with cooling or nucleation?
-
Skewness – a measure of uniformity across the surface.
-
Big cluster count – contiguous oversized cell regions.
4. Trendspotting for process control
One image is just a snapshot, and gaining insights about an individual cell doesn't really make a difference.
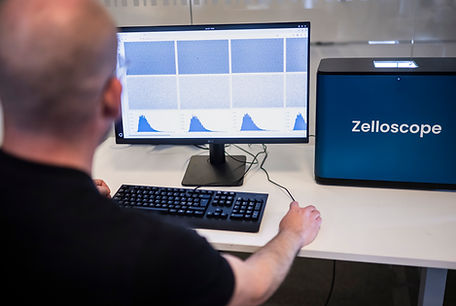
The real value is in the quantity and spotting shifts over time. With Zelloscope, you can stack histograms, compare batches, and detect subtle drifts before they become problems.
5. Get alerted when quality slips!
Set your limits, and our system will notify you immediately if foam quality crosses them. Whether it’s a sudden uptick in pinholes or a shift in cell size, you’ll know before waste piles up.

6. A database that remembers
All measurements are stored in a central database. This creates a long-term archive for audits, supports statistical process control, and gives you a foundation for continuous improvement.
Useful KPIs
Here follows a list of useful KPIs that are easy to track when using Zelloscope.
